I am Arjun.
I build data warehouses
and the AI systems
that read from them.

About
The through-line in my work is measurement. Pipeline, dashboard, forecast, or retrieval system — the question is always the same. How do you know it is right?
That has meant three things. The platform: Azure Data Factory pipelines into Snowflake, star-schema models, and SQL validation and reconciliation rules that stop bad data before it reaches a report. The reporting layer on top: Power BI with DAX and row-level security, and an 80+ KPI registry with one agreed definition per metric. And the AI layer: at Groflex AI, a RAG pipeline returning answers in 1–3 seconds with per-tenant isolation.
I am finishing an MS in Information Systems at Northeastern, after nearly two years on the data side at Accenture and a co-op at Groflex AI.
Download CVCore Expertise
- Data Engineering
- Dimensional Modeling
- Business Intelligence
- Forecasting & Experimentation
- Machine Learning
- RAG & Retrieval
Experience
Groflex AI
Data and AI Engineer Co-op
January 2026 - May 2026
- Delivered 1–3 s end-to-end RAG responses over 3+ client document sets, using Azure OpenAI embeddings and MongoDB Atlas Vector Search.
- Enforced per-tenant index isolation, so a query cannot reach another customer's documents.
- Integrated Azure OpenAI into production APIs, handling prompt templating, context management, and structured output parsing.
- Documented a registry of 80+ KPIs with business teams, giving every client metric one agreed definition.
- Enforced 7-role RBAC and PII masking in a 30+ endpoint FastAPI backend, with schema contracts on write paths.
- Shipped changes through GitHub Actions CI/CD with pytest suites and peer pull-request reviews.
Accenture
Data Analyst (Application Development Associate)
October 2022 - July 2024
Compliance and KPI reporting for a Fortune 100 US banking client.
- Cut Azure Data Factory pipeline refresh time ~40% (from 15–45 min) by tuning ETL workflows behind daily Snowflake loads.
- Built 50+ SQL validation, reconciliation, and trigger rules across 15+ source feeds, keeping bad values out of monthly leadership reports.
- Reduced weekly manual data-prep hours ~20% by automating SQL data quality checks on millions of rows per load.
- Shortened report turnaround ~25% with Power BI dashboards on star-schema models, using DAX, Power Query, and anomaly alerts.
- Wrote complex SQL in Snowflake and Databricks for compliance and KPI reporting datasets and ad-hoc analysis.
ShelfMerch
Data Intern
June 2021 - November 2021
- Caught duplicate and out-of-range sales records before load with SQL cleaning and validation routines.
- Built Power BI scorecards on weekly sales KPIs that informed inventory and merchandising decisions.
Education
Northeastern University
Master's in Information Systems
Expected Dec 2026
Includes a full-time co-op semester at Groflex AI.
- Designing Data Architecture for Business Intelligence
- Big-Data Systems and Intelligence Analytics
- Database Design and Management
- Data Science Engineering Methods and Tools
- Prompt Engineering and AI
- Reinforcement Learning for Agentic AI Systems
- Business Analysis
- Information Engineering
St Joseph's College
BBA in Information Technology
2019 - 2022
First Class with Distinction. President of the Data Science Club.
- Database Management System
- Data Warehousing & Data Mining
- Data Analytics using R
- Business Statistics
- Python Programming
Certifications
Microsoft Certified: Azure Fundamentals (AZ-900)
Google Data Analytics Professional Certificate
AWS Certified Data Engineer – Associate (in progress)
Technical Skills
Data Engineering
- ETL/ELT pipeline design and orchestration
- Azure Data Factory, Databricks, PySpark
- Dimensional modeling, star schemas, SCDs
- Schema contracts, data quality, anomaly detection
- Medallion architecture, Delta Live Tables
Analytics & Business Intelligence
- Power BI, DAX, Power Query, Tableau
- Semantic models and row-level security
- Metric definition and KPI governance
- Cohort, funnel, and segmentation analysis
- Requirements gathering and root cause analysis
Statistics & Experimentation
- Hypothesis testing and confidence intervals
- A/B testing and experimental design
- Time-series forecasting (ARIMA)
- Rolling-origin backtesting against baselines
- Error analysis and result interpretation
Machine Learning
- Regression and classification
- Feature engineering and cross-validation
- Precision, recall, ROC-AUC, PR-AUC
- Class imbalance and threshold selection
- scikit-learn, PyTorch
AI & Retrieval
- RAG end to end: chunking, embeddings, vector search
- Retrieval evaluation on labeled sets
- Per-tenant isolation in multi-tenant systems
- Azure OpenAI and Gemini SDKs
- Prompt templating, structured output, schema validation
Languages, Data Stores & Tooling
- SQL, Python, PL/SQL, R
- Pandas, NumPy, Snowflake, PostgreSQL, MongoDB, Oracle 12c
- Azure, AWS (RDS, QuickSight)
- FastAPI, Docker, Git, CI/CD
- Partitioning, indexing, query tuning
Community
Community member at the Roslindale Food Collective in Boston — logistics and distribution for a nonprofit working on food security for students and local families. Also involved with Northeastern's Off-Campus Engagement and Support program.
Featured Projects
Eight builds. Each one measured, not eyeballed.
-
Data EngineeringIMDb Analytics Platform
-
Data EngineeringChinook OLTP to Snowflake ELT
-
Business IntelligenceBI Narrative Generator
-
Machine LearningMulti-Agent RL Analytics
-
StatisticsHospital Quality Analysis
-
ForecastingNYC Taxi Demand Forecasting
-
NLP & LLMsFinancial Summarization: T5
-
Business AnalyticsGrocery E-commerce Analytics




IMDb Analytics Platform — Medallion Architecture
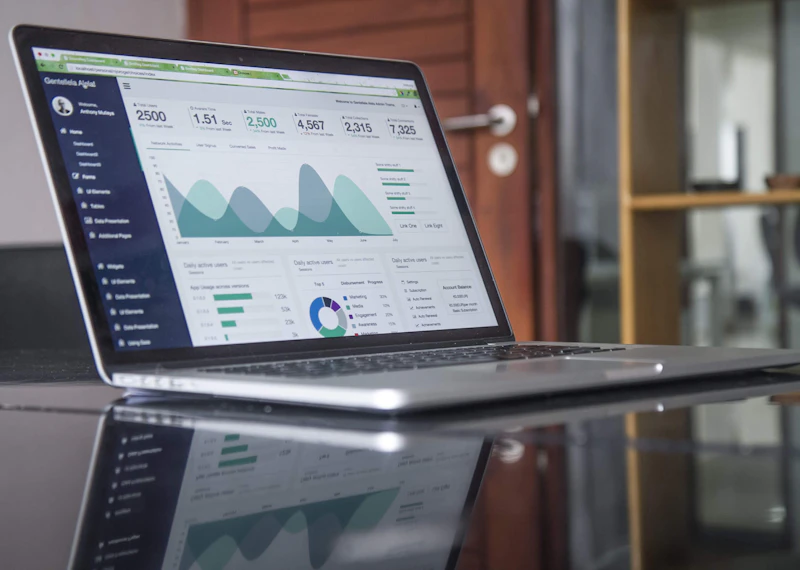
End-to-end BI platform over IMDb's non-commercial datasets, 200M+ records across 7 source files, built on a Bronze / Silver / Gold medallion architecture in Databricks with Delta Live Tables. 60 data quality validation rules run on every load, with audit lineage. The Gold layer is a star schema — 3 fact tables, 6 dimensions, 3 bridge tables — feeding 5 Power BI dashboards for title and personnel analytics.
- Databricks
- Delta Live Tables
- PySpark
- Power BI
- Star Schema
- Data Quality
- 200M+records processed
- 7source files
- 60validation rules
- 5Power BI dashboards
Chinook OLTP to Snowflake — Incremental ELT
Replicates the Chinook OLTP database into Snowflake with change data capture. Each row is hashed with SHA-256 to detect changes, and merge upserts apply them to SCD Type 1 dimensions. Extracts are staged as Parquet, then layered from staging to curated Snowflake tables, with secrets held in Azure Key Vault and validation counts checked at every layer.
- Azure Data Factory
- Snowflake
- Parquet
- Azure Key Vault
- CDC
- SCD
- SHA-256row-hash change detection
- SCD Type 1merge upserts
- Per layervalidation counts
Business Intelligence Narrative Generator
An LLM analytics app on the Google Gemini API that turns a raw CSV into executive insights and Plotly charts. Prompt templates and structured outputs keep the generation step consistent from run to run, and finished reports export to HTML, Markdown, and JSON.
- Python
- Streamlit
- Pandas
- Plotly
- Google Gemini API
- Markdown/HTML Exporters
- 25 minto a full BI report
- 3export formats
Intelligent Analytics Assistant — Multi-Agent RL System
Routes analytics tasks to specialist agents with tool calling, using contextual bandits (UCB) to choose the agent and Q-learning to coordinate them. The part I care about is the evaluation: results were validated with t-tests and confidence intervals, not judged by inspection of a few examples.
- Python
- Multi-Agent Systems
- Tool Calling
- Contextual Bandits
- Q-Learning
- Statistical Testing
- UCBcontextual-bandit routing
- Q-learningagent coordination
- t-tests + CIsresult validation
Hospital Quality Analysis — CMS Hospital Compare
Merged CMS Hospital Compare outcome and hospital-level datasets for 4,000+ US hospitals, reviewed outliers with boxplots, and tested whether 30-day heart attack mortality differs by hospital type. A one-way ANOVA shows that it does, and hospitals were then ranked by outcome.
- R
- ANOVA
- CMS Hospital Compare
- Hypothesis Testing
- Data Merging
- 4,000+hospitals analyzed
- p = 0.000826one-way ANOVA
NYC Taxi Demand Forecasting — ARIMA in R
Forecasts hourly NYC TLC taxi demand for January 2025 with ARIMA in R, and maps demand volatility in a day-by-hour heatmap. A modeled estimate, built with dplyr and lubridate, puts the revenue lost in driver-shortage hours at $300–400 per hour.
- R
- ARIMA
- tidyverse
- data.table
- ggplot2
- Time Series
- Hourlydemand forecast
- Day × hourvolatility heatmap
- $300–400/hrmodeled shortage-hour loss
Financial Summarization — T5 Fine-Tuning
Fine-tuned T5 to summarize financial text in PyTorch with Transformers, running a hyperparameter search on GPU with FP16 mixed precision. Every candidate model was scored with ROUGE and BLEU on a held-out test split, and the final configuration was picked on those scores rather than on a few good-looking examples.
- Python
- PyTorch
- Transformers
- T5
- ROUGE / BLEU
- Fine-Tuning
- Held-outtest split
- ROUGE + BLEUmodel selection
- FP16GPU training
Grocery E-commerce Analytics — Family Business
Analytics for my family's grocery business selling on Amazon. I tracked sales, orders, and stock-outs across 25–50 SKUs from Seller Central in an Excel and Google Sheets dashboard. When sales dropped unexpectedly, I drilled into SKU-level order and inventory data to isolate the root cause.
- Amazon Seller Central
- Excel
- Google Sheets
- Root Cause Analysis
- Inventory Tracking
- 25–50grocery SKUs tracked
- Root causefound for a sales drop
Get In Touch
I finish at Northeastern in December 2026 and I am available from January 2027.
Looking for data engineering, analytics engineering, data science, and applied machine learning roles. Anywhere in the US.